

Understanding Different Types of Chart Patterns
Understanding different types of chart patterns in forex trading play a crucial role in analyzing market trends and predicting future price movements. These patterns are formed by the fluctuations in currency prices over time and can signal potential opportunities for traders. Let’s explore some of the most common and significant forex chart patterns that traders use to make accurate decisions.
Head and Shoulder pattern
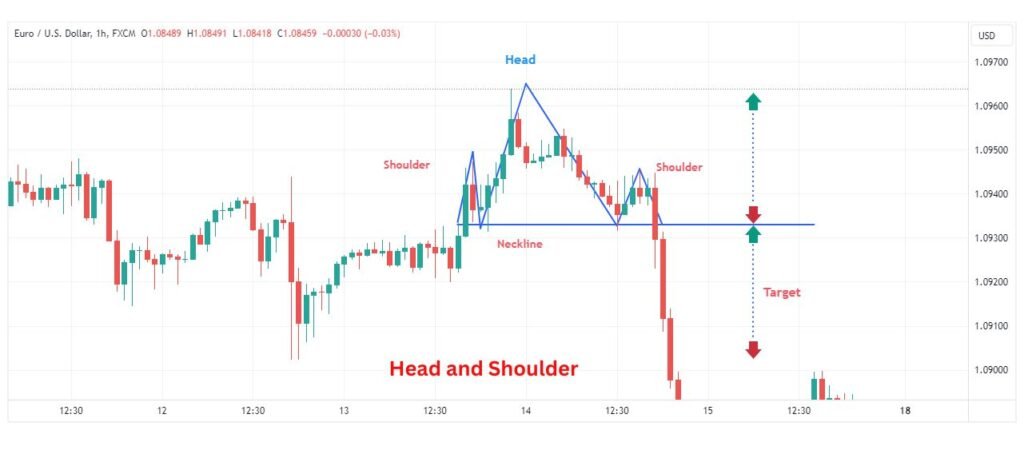
The head and shoulders chart patterns consists of three peaks with the middle peak (head) being higher than the other two (shoulders). It signals a potential reversal from bullish to bearish or vice versa.
Traders enter short positions after the neckline (support level) is broken following the completion of the right shoulder. The pattern’s height can be used to project a price target.
Advantages:
Reliability: The Head and Shoulders pattern is widely recognized and studied, making it one of the more reliable patterns in technical analysis. Traders often trust its signals of trend reversal.
Clear Entry and Exit Points: One of the biggest advantages is that it provides clear entry and exit points. Traders can enter a trade after the pattern completes with a breakout below the neckline, providing a defined risk level.
Risk Management: Since the pattern provides clear stop-loss levels (above the right shoulder), traders can manage their risk effectively. This structured approach is favored by many traders who prioritize risk management.
Price Targets: The pattern also suggests potential price targets based on the distance from the head to the neckline, providing traders with an idea of how far the price might move after the breakout.
Disadvantages:
False Signals: Like any technical pattern, Head and Shoulders formations are not foolproof. Sometimes what appears to be a pattern may not materialize fully, leading to false signals and potential losses if trades are executed prematurely.
Complexity in Identification: Identifying a Head and Shoulders pattern requires a good understanding of technical analysis. Novice traders may struggle to distinguish between a genuine pattern and random price fluctuations.
Market Volatility: In volatile markets, the neckline may be breached temporarily, leading to whipsaws where the price reverses shortly after breaking out. This can trigger premature entries or exits.
Timeframe Sensitivity: The effectiveness of the pattern can vary depending on the timeframe used for analysis. What looks like a Head and Shoulders pattern on a shorter timeframe might not be significant on a longer timeframe.
Flag and Pole Pattern
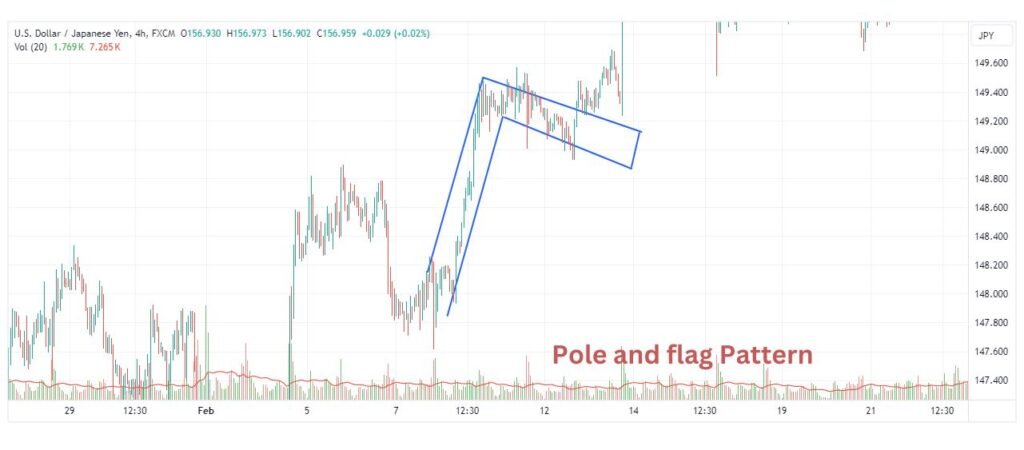
Pole and flag chart patterns is a bullish continuation pattern. In this pattern there is a pole along with a flag formation in the chart. It is indicates the pause or consolidation of price in flag before the price moves in upward direction.
In the pole and flag pattern, figuring out the target is usually done by measuring how tall the pole is (that first big price move) and then adding that measurement to where the flag pattern breaks out. It may be not exact value of the length of pole.
Advantages:
Clear Trend Continuation Signal: The Pole and Flag pattern is renowned for indicating trend continuation. After a strong upward or downward movement (the pole), the subsequent consolidation (the flag) suggests that the trend may resume. This clarity helps traders align with the prevailing market direction.
Defined Entry and Exit Points: Traders can enter a trade after the breakout from the flag pattern, which typically occurs in the direction of the previous trend. This provides clear entry points with defined risk levels (often placing stop-loss orders just outside the flag).
Simplicity: The simplicity of the pattern makes it accessible even to novice traders. It’s easy to identify and interpret, reducing the likelihood of misinterpretation compared to more complex patterns.
Shorter Timeframe Suitability: The Pole and Flag pattern is effective on shorter timeframes, making it suitable for day traders and those who prefer faster market movements.
Disadvantages:
False Breakouts: Like many technical patterns, false breakouts can occur where the price briefly moves beyond the flag pattern but fails to sustain the momentum. This can lead to hit the stop loss if traders enter positions prematurely.
Market Volatility Impact: In highly volatile markets, the flag pattern may not form as neatly or may break out unpredictably. This volatility can make it challenging to execute trades based solely on the pattern.
Limited Price Targets: Unlike some other patterns, the Pole and Flag doesn’t provide explicit price targets. Traders may need to rely on other technical indicators or market analysis to gauge potential price movements after the breakout.
Over-reliance Risk: Relying solely on one pattern for trading decisions can be risky. Traders should consider combining the Pole and Flag pattern with other technical and fundamental analysis tools for more comprehensive trading strategies.
Symmetrical Triangle
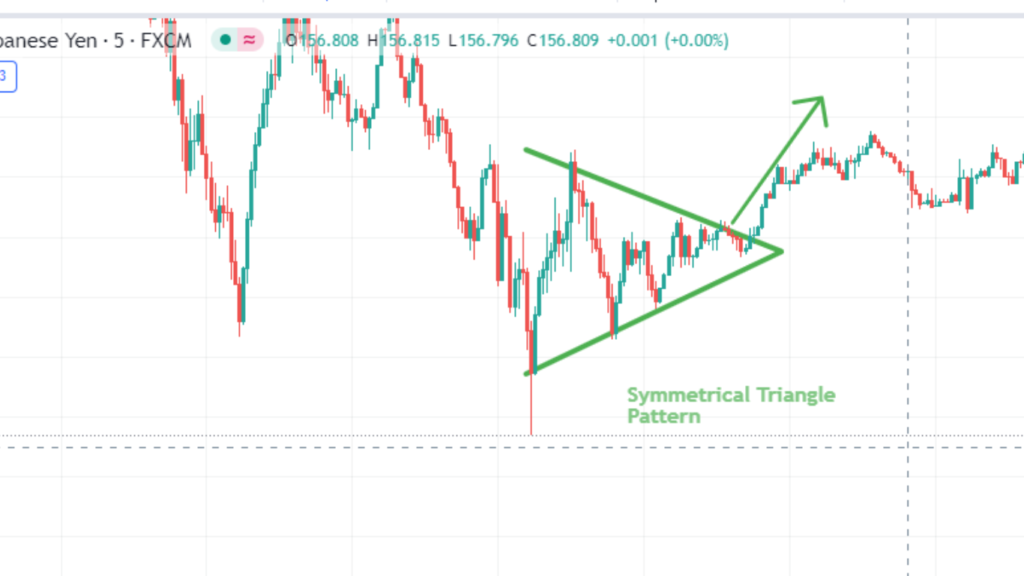
A symmetrical triangle chart patterns is formed when the price consolidates between two converging trend lines. It indicates a period of indecision in the market, with neither buyers nor sellers gaining dominance.
Traders anticipate a breakout from the triangle, which could lead to a continuation of the existing trend or a reversal. Entry points are often near the apex of the triangle, with stop-loss orders placed just outside the opposite trend line.
Advantages:
Reliable Breakout Signals: The Symmetrical Triangle pattern is known for providing reliable breakout signals. Traders anticipate a significant price movement after the price breaks out of the triangle formation, whether it’s to the upside or downside.
Clear Entry and Exit Points: This pattern offers clear entry points upon breakout above or below the triangle’s boundaries. Traders often set stop-loss orders just outside the triangle to manage risk effectively, which helps in maintaining disciplined trading.
Versatility: Symmetrical Triangles can form across various timeframes, making them versatile for both short-term and long-term traders. The pattern’s reliability across different timeframes enhances its appeal to a wide range of traders.
Pattern Confirmation: The Symmetrical Triangle pattern is well-defined, with its upper and lower trendlines converging towards each other. This clarity helps traders confirm the pattern’s validity and distinguish it from other formations.
Disadvantages:
False Breakouts: Despite its reliability, false breakouts can occur where the price briefly moves beyond the triangle boundaries but fails to sustain the momentum. Traders need to be cautious and consider waiting for confirmation before entering a trade.
Subjectivity in Boundaries: Drawing precise trendlines for the Symmetrical Triangle can be subjective, leading to different interpretations among traders. This subjectivity can sometimes affect the accuracy of identifying the pattern.
Potential for Choppy Markets: In choppy or range-bound markets, the Symmetrical Triangle may form but fail to provide a clear breakout signal. Traders may need additional confirmation from other technical indicators to avoid false signals.
Target Estimation: While the pattern suggests a breakout, it doesn’t provide specific price targets like some other patterns. Traders often rely on measuring the widest part of the triangle to estimate potential price movements post-breakout.
Ascending Triangle
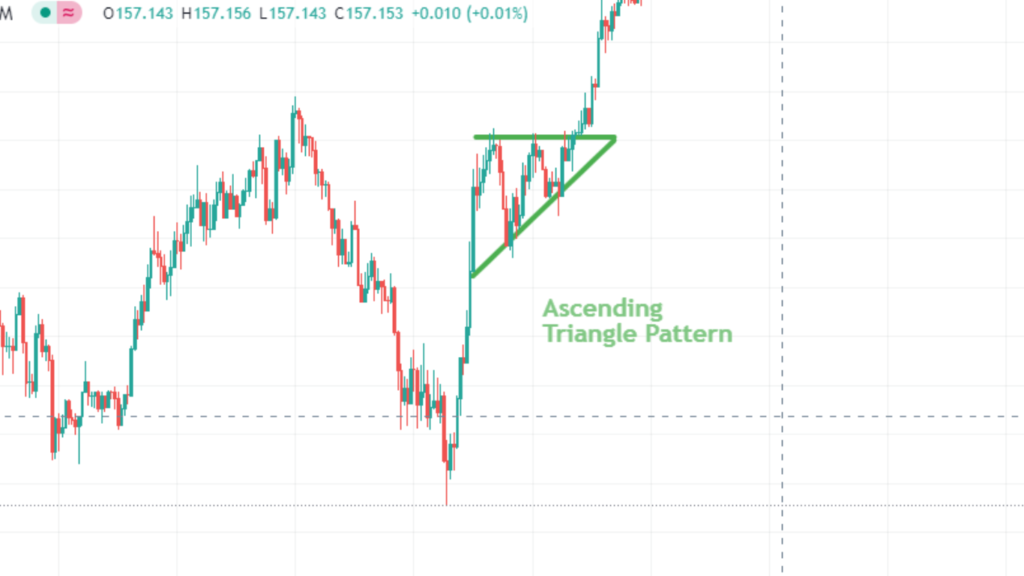
An ascending triangle chart patterns forms when there is a horizontal resistance level and an upward-sloping support line. This pattern suggests that buyers are becoming increasingly aggressive.
Traders look for a breakout above the resistance level, signaling a potential upward continuation. The height of the triangle can be used to estimate a price target.
Advantages:
Reliable Continuation Signal: The Ascending Triangle pattern is well-regarded for indicating a continuation of an existing uptrend. It typically forms when there is a strong upward movement followed by a period of consolidation where the price consolidates into a triangle shape with a horizontal resistance line and a rising trendline.
Clear Entry and Exit Points: Traders can enter a trade after the breakout above the horizontal resistance line, which confirms the pattern’s bullish bias. This provides clear entry points with defined risk levels (often placing stop-loss orders just below the ascending trendline).
Measurable Price Target: The pattern offers a price target by measuring the height of the triangle at its widest point and adding it to the breakout level. This helps traders estimate the potential upward movement after the breakout, aiding in setting profit targets.
Confirmation of Trend: Ascending Triangles validate the bullish sentiment in the market as they typically occur during uptrends. This confirmation can boost trader confidence in their positions and strengthen the overall trading strategy.
Disadvantages:
False Breakouts: Despite its reliability, false breakouts can occur where the price briefly moves above the resistance line but fails to sustain the momentum. Traders should wait for confirmation and consider the possibility of false signals before entering trades.
Subjectivity in Trendline Placement: Drawing precise trendlines for the Ascending Triangle can be subjective, leading to different interpretations among traders. This subjectivity can sometimes affect the accuracy of identifying the pattern and its breakout points.
Market Volatility Impact: In highly volatile markets, the Ascending Triangle may not form as neatly or may experience erratic price movements, making it challenging to execute trades based solely on the pattern.
Over-reliance Risk: Relying solely on one pattern for trading decisions can be risky. Traders should consider combining the Ascending Triangle pattern with other technical indicators or market analysis for a more comprehensive trading strategy.
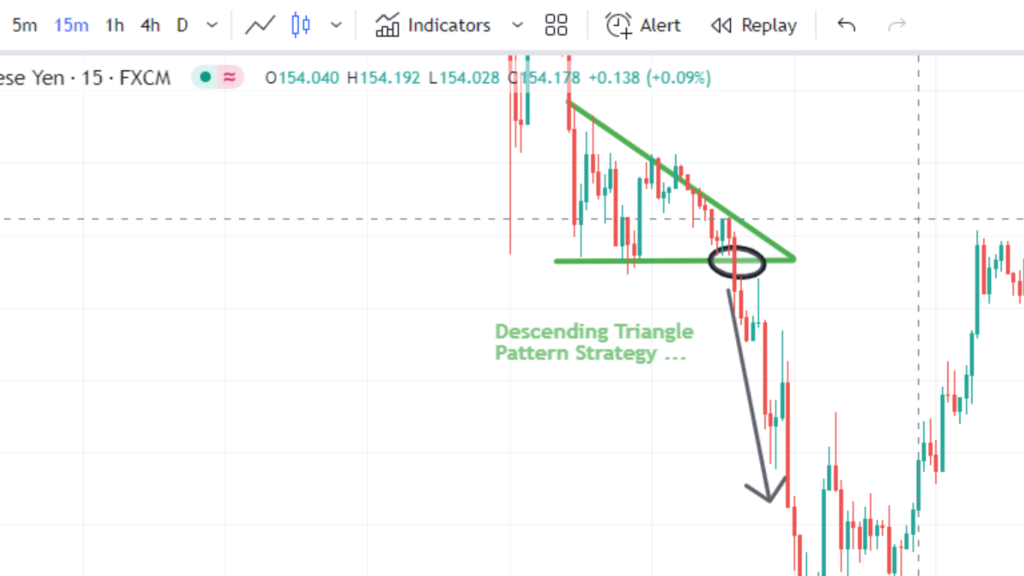
Descending Triangle
A descending triangle chart patterns is characterized by a horizontal support level and a downward-sloping resistance line. It indicates that sellers are gaining control, pushing the price lower.
Traders expect a breakdown below the support level, suggesting a potential downward continuation. The pattern’s height helps estimate a price target.
Advantages:
Reliable Reversal Signal: The Descending Triangle pattern is known for signaling a potential reversal of an existing downtrend. It forms when the price consolidates into a triangle shape with a horizontal support line and a descending trendline, indicating that sellers are gradually losing momentum.
Clear Entry and Exit Points: Traders can enter a trade after the breakout below the horizontal support line, confirming the pattern’s bearish bias. This provides clear entry points with defined risk levels (often placing stop-loss orders just above the descending trendline).
Measurable Price Target: Similar to the Ascending Triangle, the Descending Triangle offers a price target by measuring the height of the triangle at its widest point and subtracting it from the breakout level. This helps traders estimate the potential downward movement after the breakout, aiding in setting profit targets.
Confirmation of Trend Reversal: Descending Triangles validate the bearish sentiment in the market as they typically occur during downtrends. This confirmation can strengthen trader confidence in their positions and reinforce their trading strategy.
Disadvantages:
False Breakouts: Despite its reliability, false breakouts can occur where the price briefly moves above the descending trendline but fails to sustain the downward momentum. Traders should exercise caution, wait for confirmation, and consider the possibility of false signals before entering trades.
Subjectivity in Trendline Placement: Drawing precise trendlines for the Descending Triangle can be subjective, leading to different interpretations among traders. This subjectivity can sometimes affect the accuracy of identifying the pattern and its breakout points.
Market Volatility Impact: In highly volatile markets, the Descending Triangle may not form as clearly or may experience erratic price movements, making it challenging to execute trades solely based on the pattern.
Over-reliance Risk: Relying solely on one pattern for trading decisions can be risky. Traders should complement the Descending Triangle pattern with other technical indicators or market analysis for a more comprehensive trading strategy.
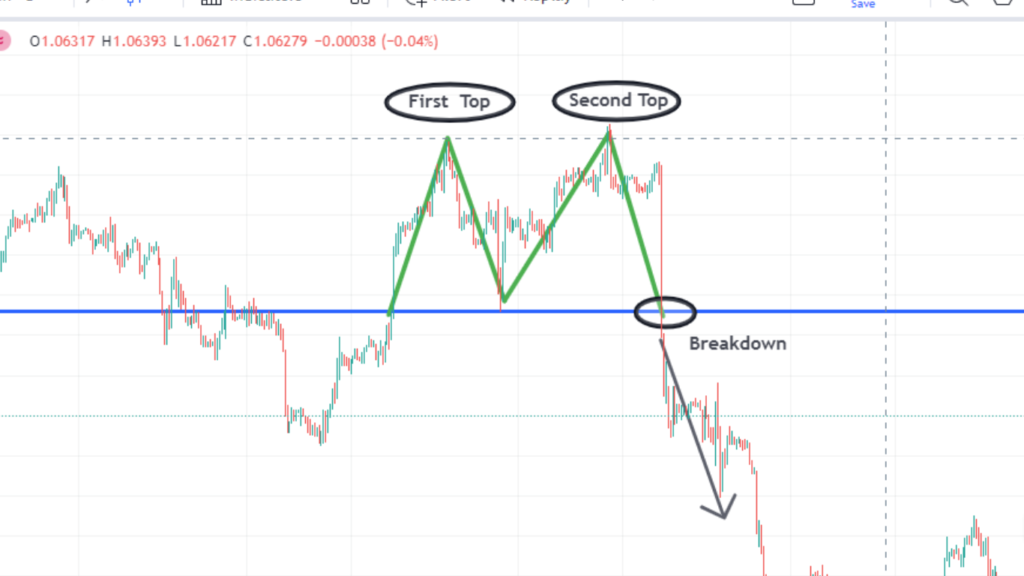
Double Top
A double top chart patterns forms when the price reaches a peak (resistance) twice and fails to break higher, signaling a potential reversal downward.
Traders enter short positions after the neckline (support level) is breached, with the pattern’s height used for estimating a price target.
Advantages:
Clear Reversal Signal: The Double Top pattern is a well-known bearish reversal pattern. It forms after an uptrend and indicates a potential trend reversal when the price fails to break above a resistance level twice, signaling weakness in buying momentum.
Defined Entry and Exit Points: Traders can enter a trade after the price breaks below the neckline (the trough between the two peaks), confirming the pattern. This provides a clear entry point with a defined risk level (often placing stop-loss orders just above the second peak).
Disdvantages:
False Signals: Despite its reliability, false signals can occur where the price temporarily breaks below the neckline but then reverses back above it. Traders should wait for confirmation and consider additional technical indicators to validate the pattern.
Subjectivity: Identifying the Double Top pattern can be subjective and prone to interpretation differences among traders. This subjectivity can lead to varying opinions on whether a pattern has formed or not.
Using Chart Patterns Effectively in Forex Trading:
Confirmation: It’s crucial to wait for confirmation signals such as price breaks above/below trendlines or significant candlestick patterns before entering trades based on chart patterns.
Risk Management: Always implement proper risk management strategies, including placing stop-loss orders and calculating position sizes based on the pattern’s projected targets and potential losses.
Combining with Other Indicators: Consider using chart patterns in conjunction with technical indicators (e.g., moving averages, RSI, MACD) and fundamental analysis to strengthen trade decisions.
Conclusion:
Mastering forex chart patterns is a valuable skill for traders seeking to understand market dynamics and identify potential trading opportunities. By recognizing these patterns and understanding their implications, traders can enhance their ability to make informed decisions and improve their overall trading performance.
Whether you’re a novice trader or an experienced investor, incorporating chart patterns into your trading strategy can provide a structured approach to analyzing price movements and navigating the complexities of the forex market. Continual practice and observation of patterns in real-time charts will further hone your pattern recognition skills and contribute to your success in forex trading.