What is Forex Market?
Discover how to start forex trading with our comprehensive guide. Forex market which is also called the FX market is a decentralized global marketplace for currency transactions. The global financial market is currently the largest and most liquid market, with an average daily transaction value of around 5 trillion dollars.
There is different currency pair in forex market. Some of the major currency pairs are EUR/USD USD/JPY), GBP/USD, and USD/CHF.
A large number of players are participating in the forex market, including governments, Bank, corporations, financial institutions, traders, speculators, HNI and investors. Due to its global reach, foreign exchange transactions continue to 24 hours a day, five days a week, across several time zones.
Forex markets are open 24 hours a day, five days a week. But it’s devided into four main sessions, which are:
- Sydney – 10 pm to 7 am UTC
- Tokyo – 12am to 9am UTC
- London –8 am to 4 pm UTC
- New York – 1 pm to 10 pm UTC
Why Trade Forex?
High Liquidity
Accessibility
Leverage
How to Start Forex Trading?
From getting knowledge about how to start forex trading to trade your selected Forex assets, you should open a trading account after selecting the best broker. Make sure to investigate the how many account options are available and pick the right one for your requirements.
All traders are advised to start with a demo account when they don’t have enough knowledge about how to start forex trading so they can practice trading without having a low risk of real money. You may switch to your real money trading account when you’re ready to trade for real gains.
Master The Forex Trading Terminology
- Pip: The smallest price movement in a currency pair.
- Lot: Standardized unit of trading size.
- Bid/Ask: The price at which you can sell/buy a currency pair.
- Spread: The difference between the bid and ask price.
- Margin: The amount of money required to open a leveraged position.
- Leverage: The use of borrowed funds to increase trading position.
- Stop Loss: An order to close a position at a predetermined price to limit losses.
- Take Profit: An order to close a position at a predetermined price to lock in profits.
- Margin Call: Notification to add more funds to avoid position closure due to insufficient margin.
- Base Currency: The first currency in a currency pair.
- Quote Currency: The second currency in a currency pair.
- Major/Minor/Exotic Pairs: Classification of currency pairs based on liquidity and trading volume.
- Liquidity: The ability to buy or sell a currency pair without causing significant price change.
- Volatility: The degree of price fluctuation in a currency pair.
- Technical Analysis: Analysis based on historical price data to predict future price movements.
- Fundamental Analysis: Analysis based on economic indicators and news to predict future price movements.
- Slippage: The difference between expected price and actual execution price for a trade.
Understanding Forex Charts and Analysis
Types of Forex chart are graphical representations of price movements of currency pairs over specific periods of time. Traders use these charts to analyze trends, identify trading opportunities, and make informed decisions.
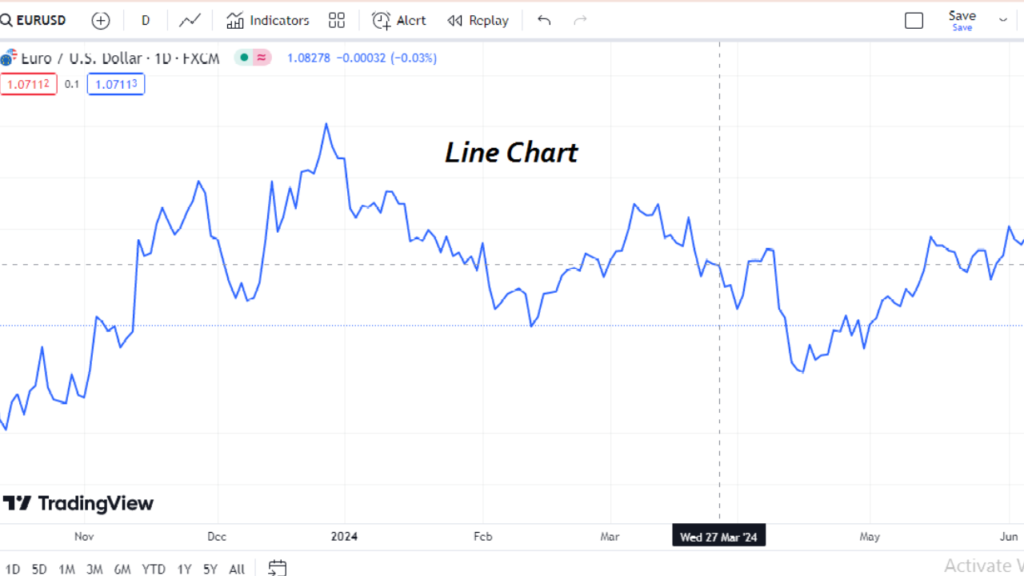
Line Chart
A line chart is the simplest type, showing the closing prices of a currency pair plotted over time. It connects the closing prices with a line, providing a clear visual representation of the overall trend. Line charts are useful for identifying long-term trends and are beginner-friendly due to their simplicity.
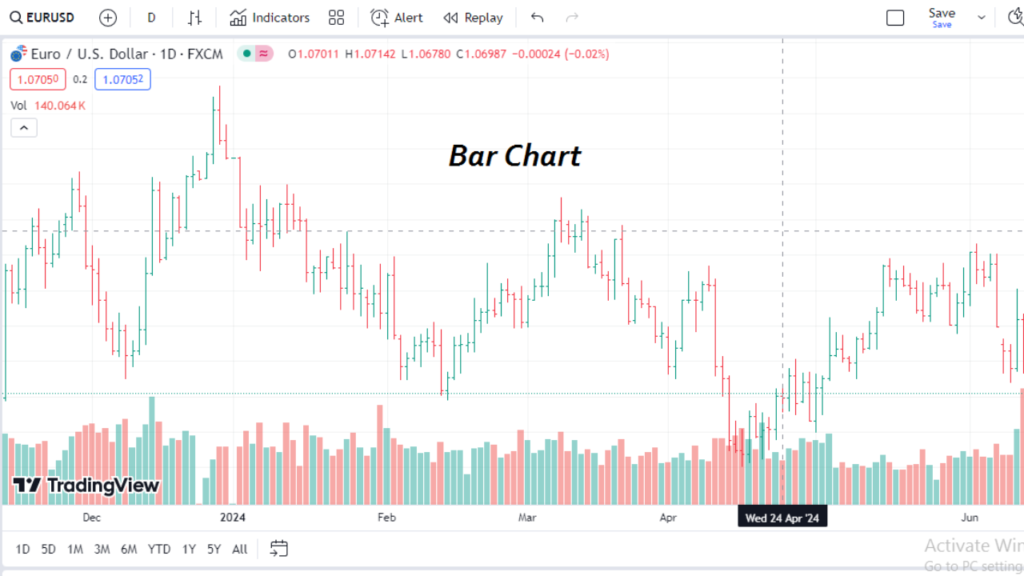
Bar Chart
Bar chart, also known as OHLC (Open, High, Low, Close) charts, provide more detailed information compared to line charts. Each bar represents the price range during a specific period, displaying the high and low prices with a vertical line and the opening and closing prices with horizontal ticks on the sides. Bar charts help traders assess price volatility and market sentiment within each time period.
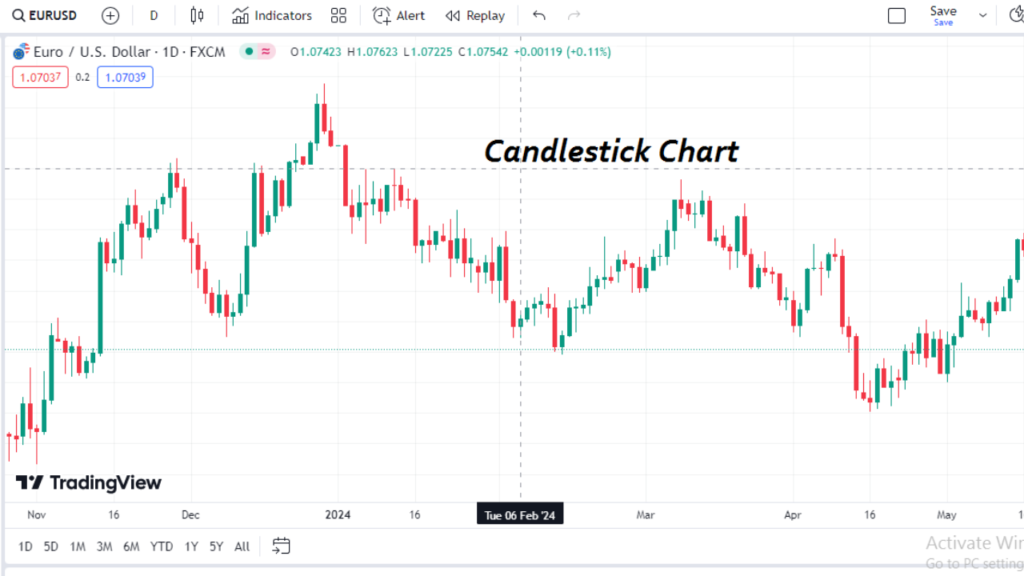
Candlestick Chart
Candlestick chart are widely used in forex trading for their visual clarity and ability to convey price action effectively. Each candlestick represents the price movement of a currency pair over a particular period (e.g., 1 minute, 1 hour, 1 day). The body of the candlestick shows the opening and closing prices, while the wicks (or shadows) indicate the high and low prices reached during the period. Candlesticks are color-coded, typically using green or white for bullish (price increased) and red or black for bearish (price decreased) movements.
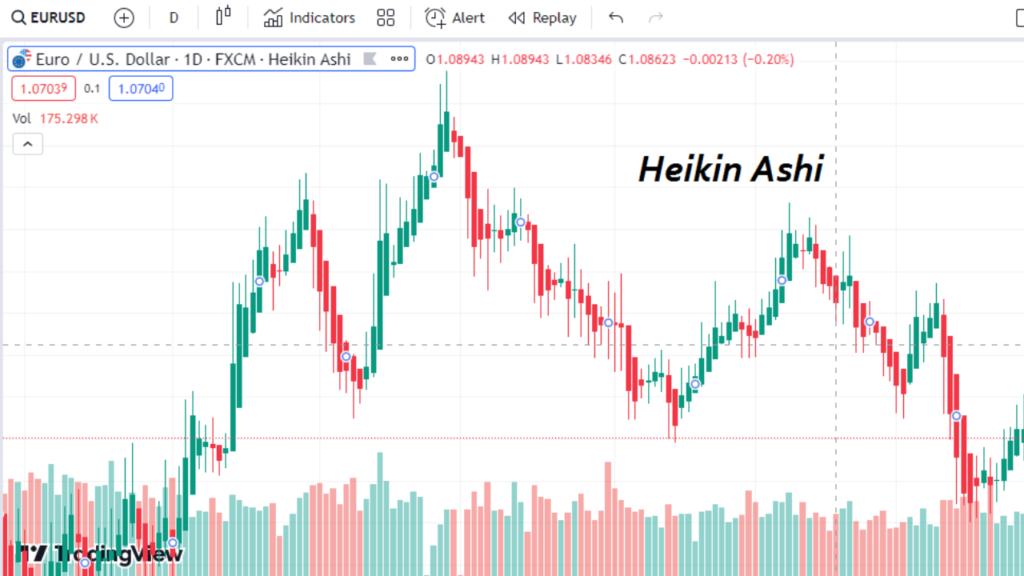
Heikin Ashi Chart
Heikin Ashi chart are derived from candlestick charts but use modified formulas to smooth out price fluctuations and emphasize trends. They are beneficial for identifying trends and potential trend reversals more clearly than traditional candlestick charts.